Captain CAT
A climate-aware design co-pilot for courtyards that think, adapt, and respond.
Urban courtyards are overheating, underused, and disconnected from how people actually live. Captain CAT reimagines them as intelligent, social, climate-responsive spaces through conversation, data, and design logic.
Origin Story
Courtyards sit at the intersection of climate, community, and daily life, yet they are often designed through static diagrams and late-stage simulations. Captain CAT was developed to shift this moment earlier, transforming vague intentions into spatial logic, climate feedback, and geometry in real time. Acting as a friendly design co-pilot, CAT invites dialogue instead of prescriptions, making climate intelligence accessible during concept design.
How Does CAT Work?
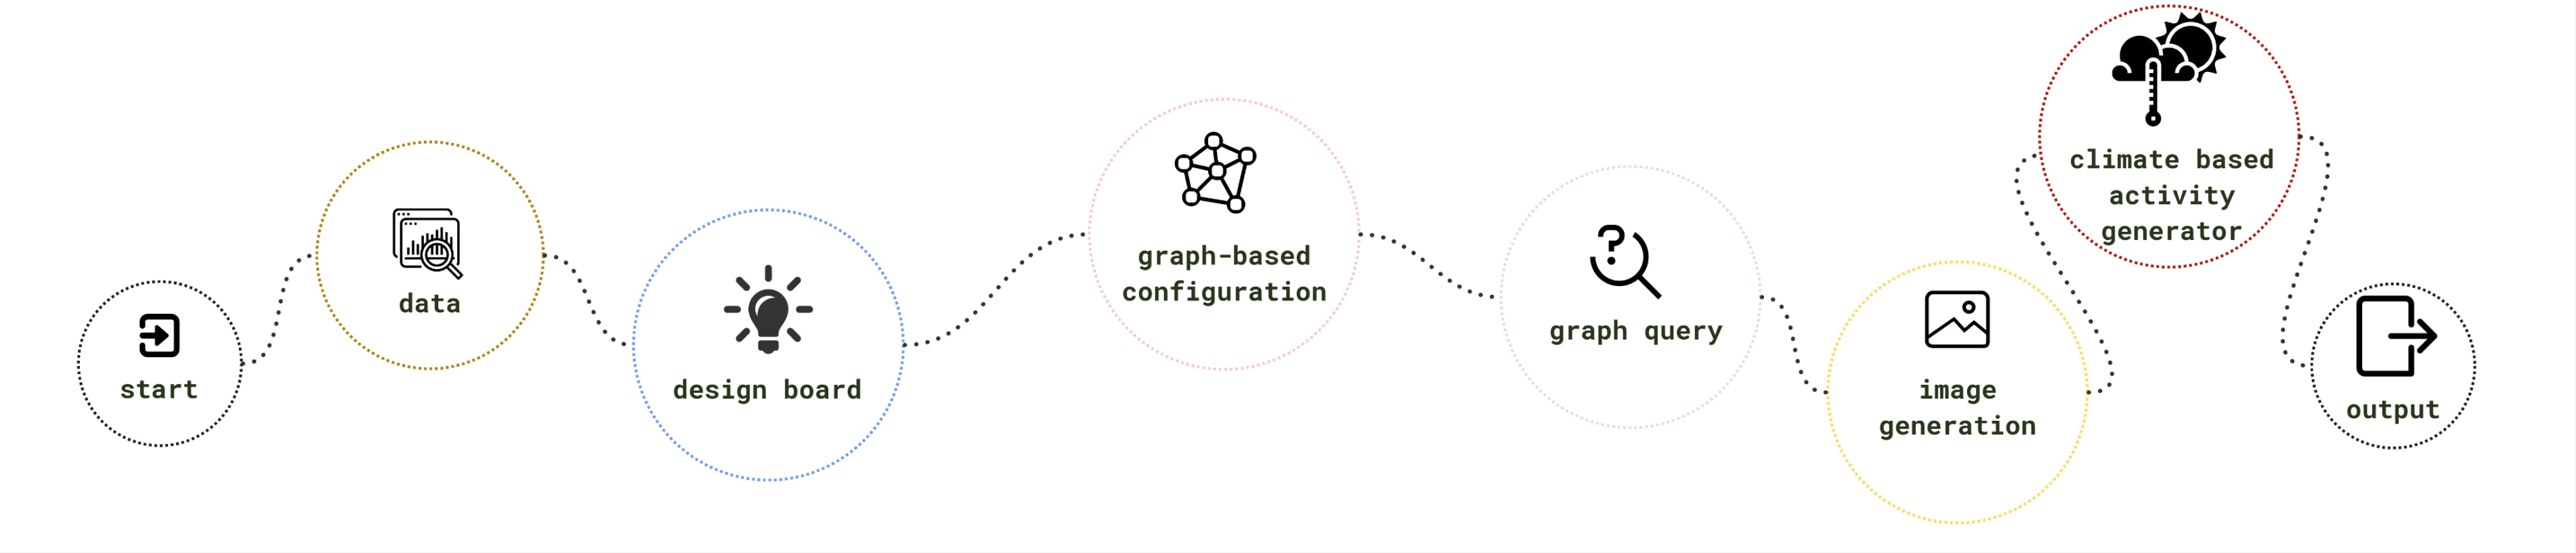
What this diagram says
The pipeline is labelled in four bands. Inputs: start, data, case studies, design parameters, ML data, climate data, design board, user requirements. Graph stage: graph query, graph-based configuration, interactive graph. Geometry: possible geometries, courtyard division, multiple versions. Analysis and output: comfort analysis, climate based activity generator, activity suggestions, image generation, output.
Conversational Input
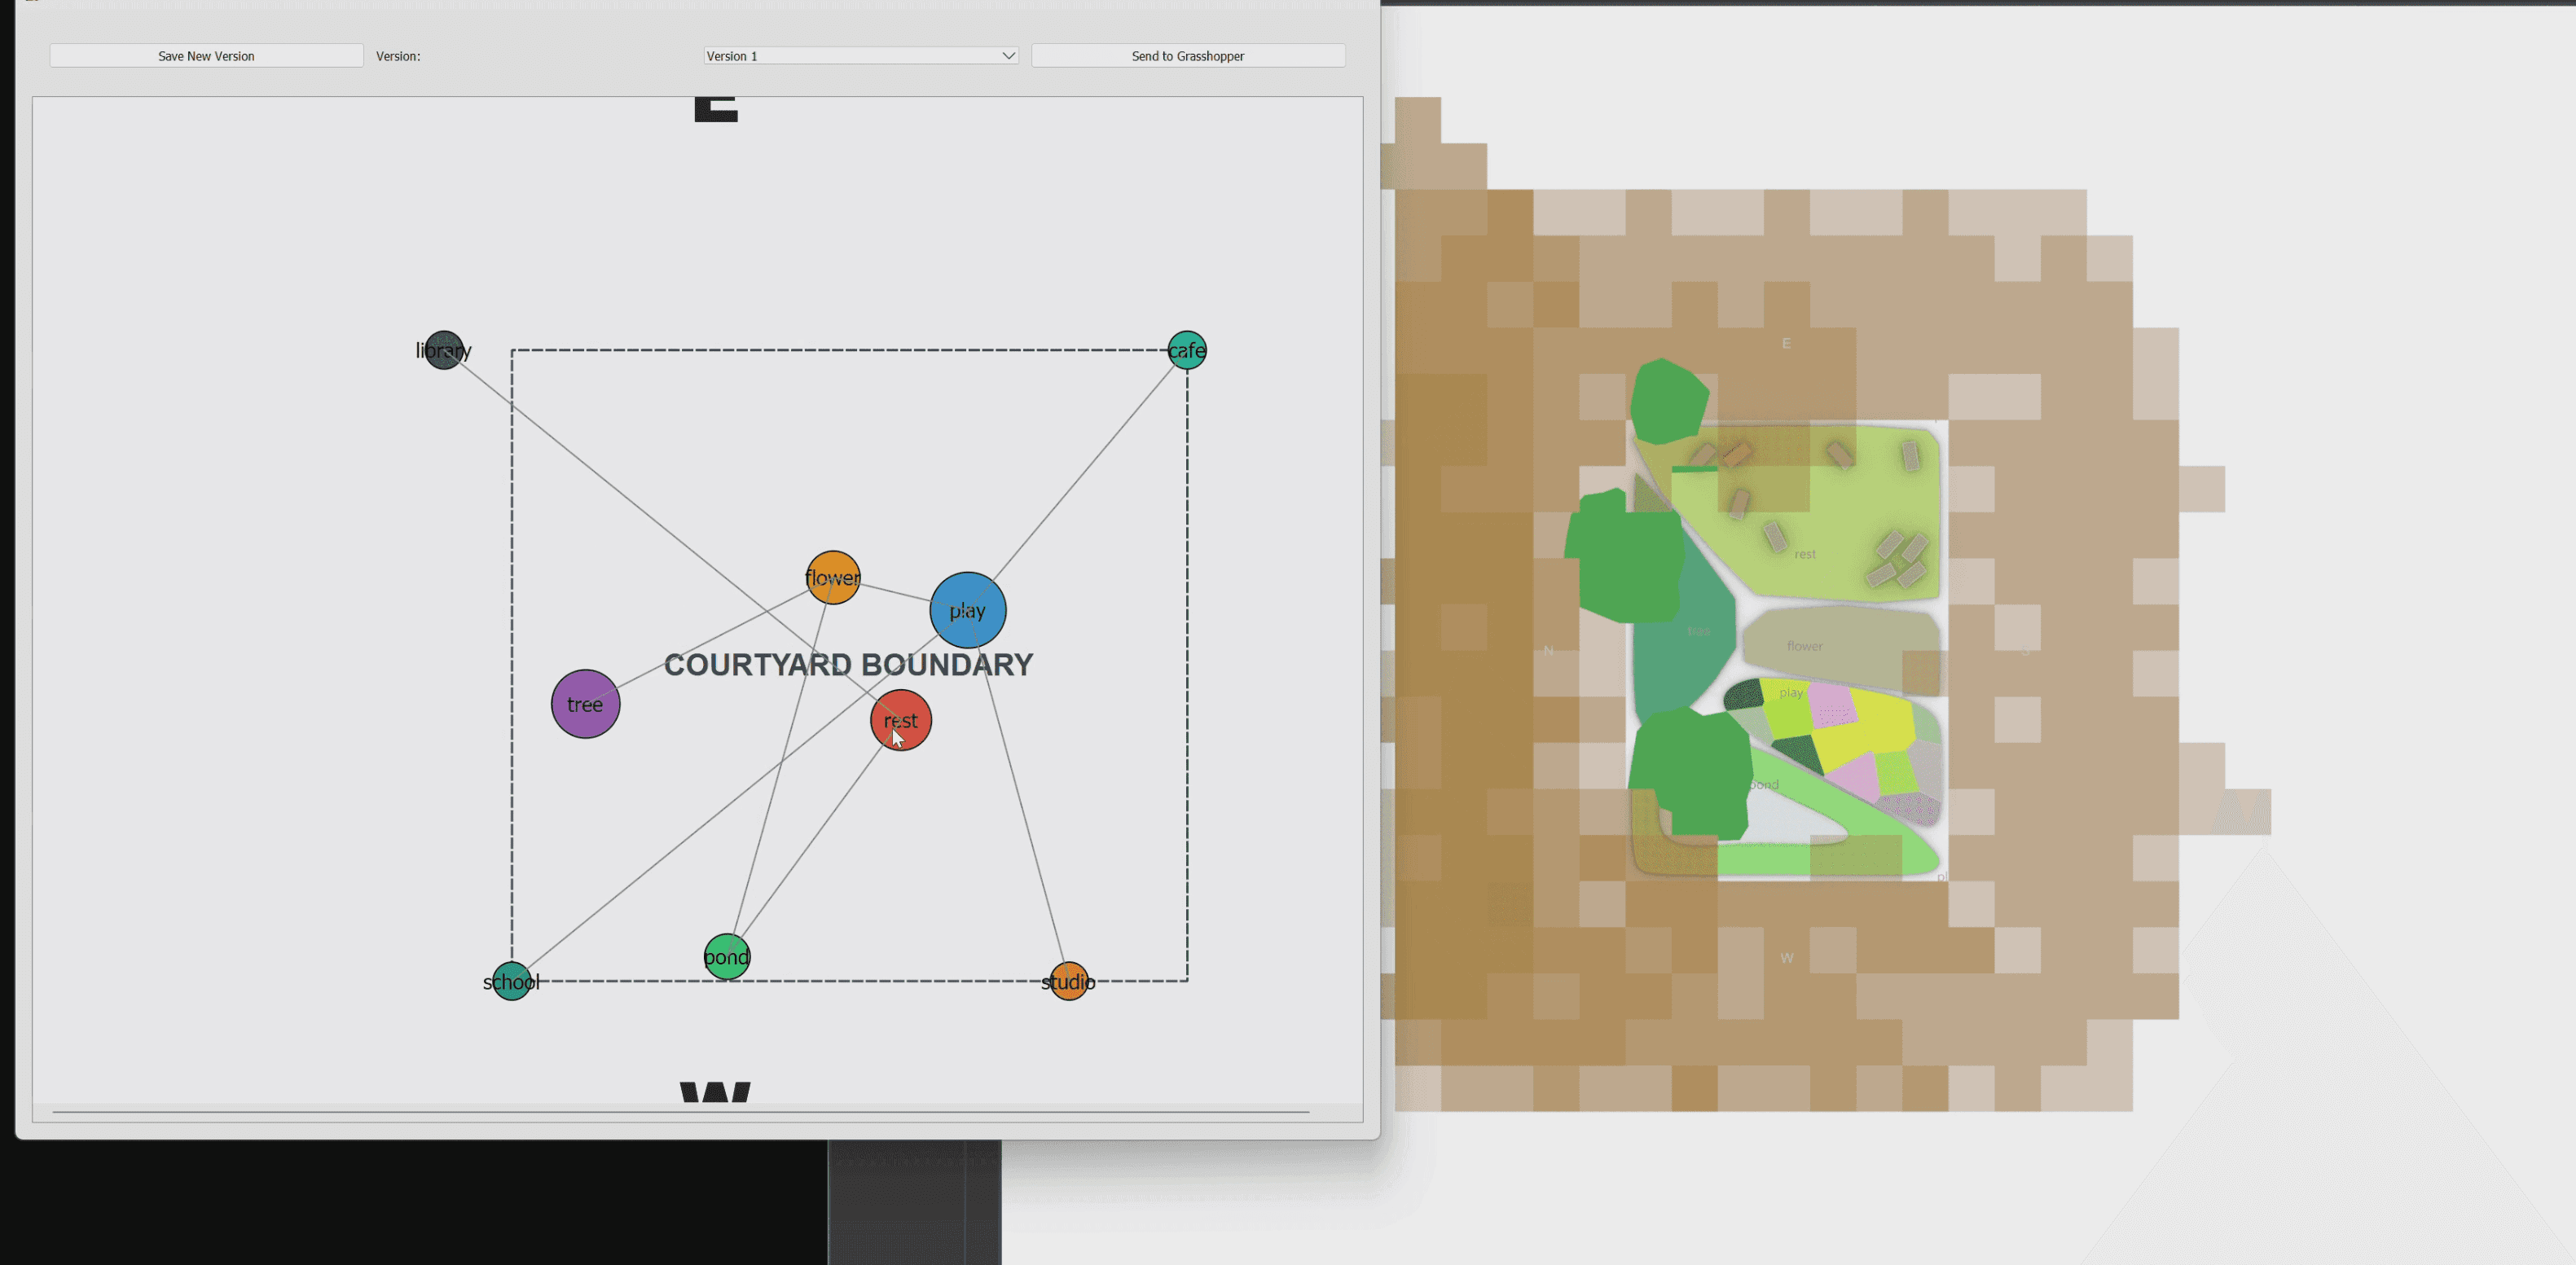
Designers describe needs in natural language, and CAT parses them into programmatic intents, constraints, and adjacencies instead of fixed forms.
- Shade
- Play
- Water
- Rest
- Visibility
Graph Based Learning
Each courtyard function becomes a node in a custom graph system. Relationships encode:
- Proximity. What wants to sit near what.
- Conflict. What cannot share an edge.
- Synergy. What gets better together.
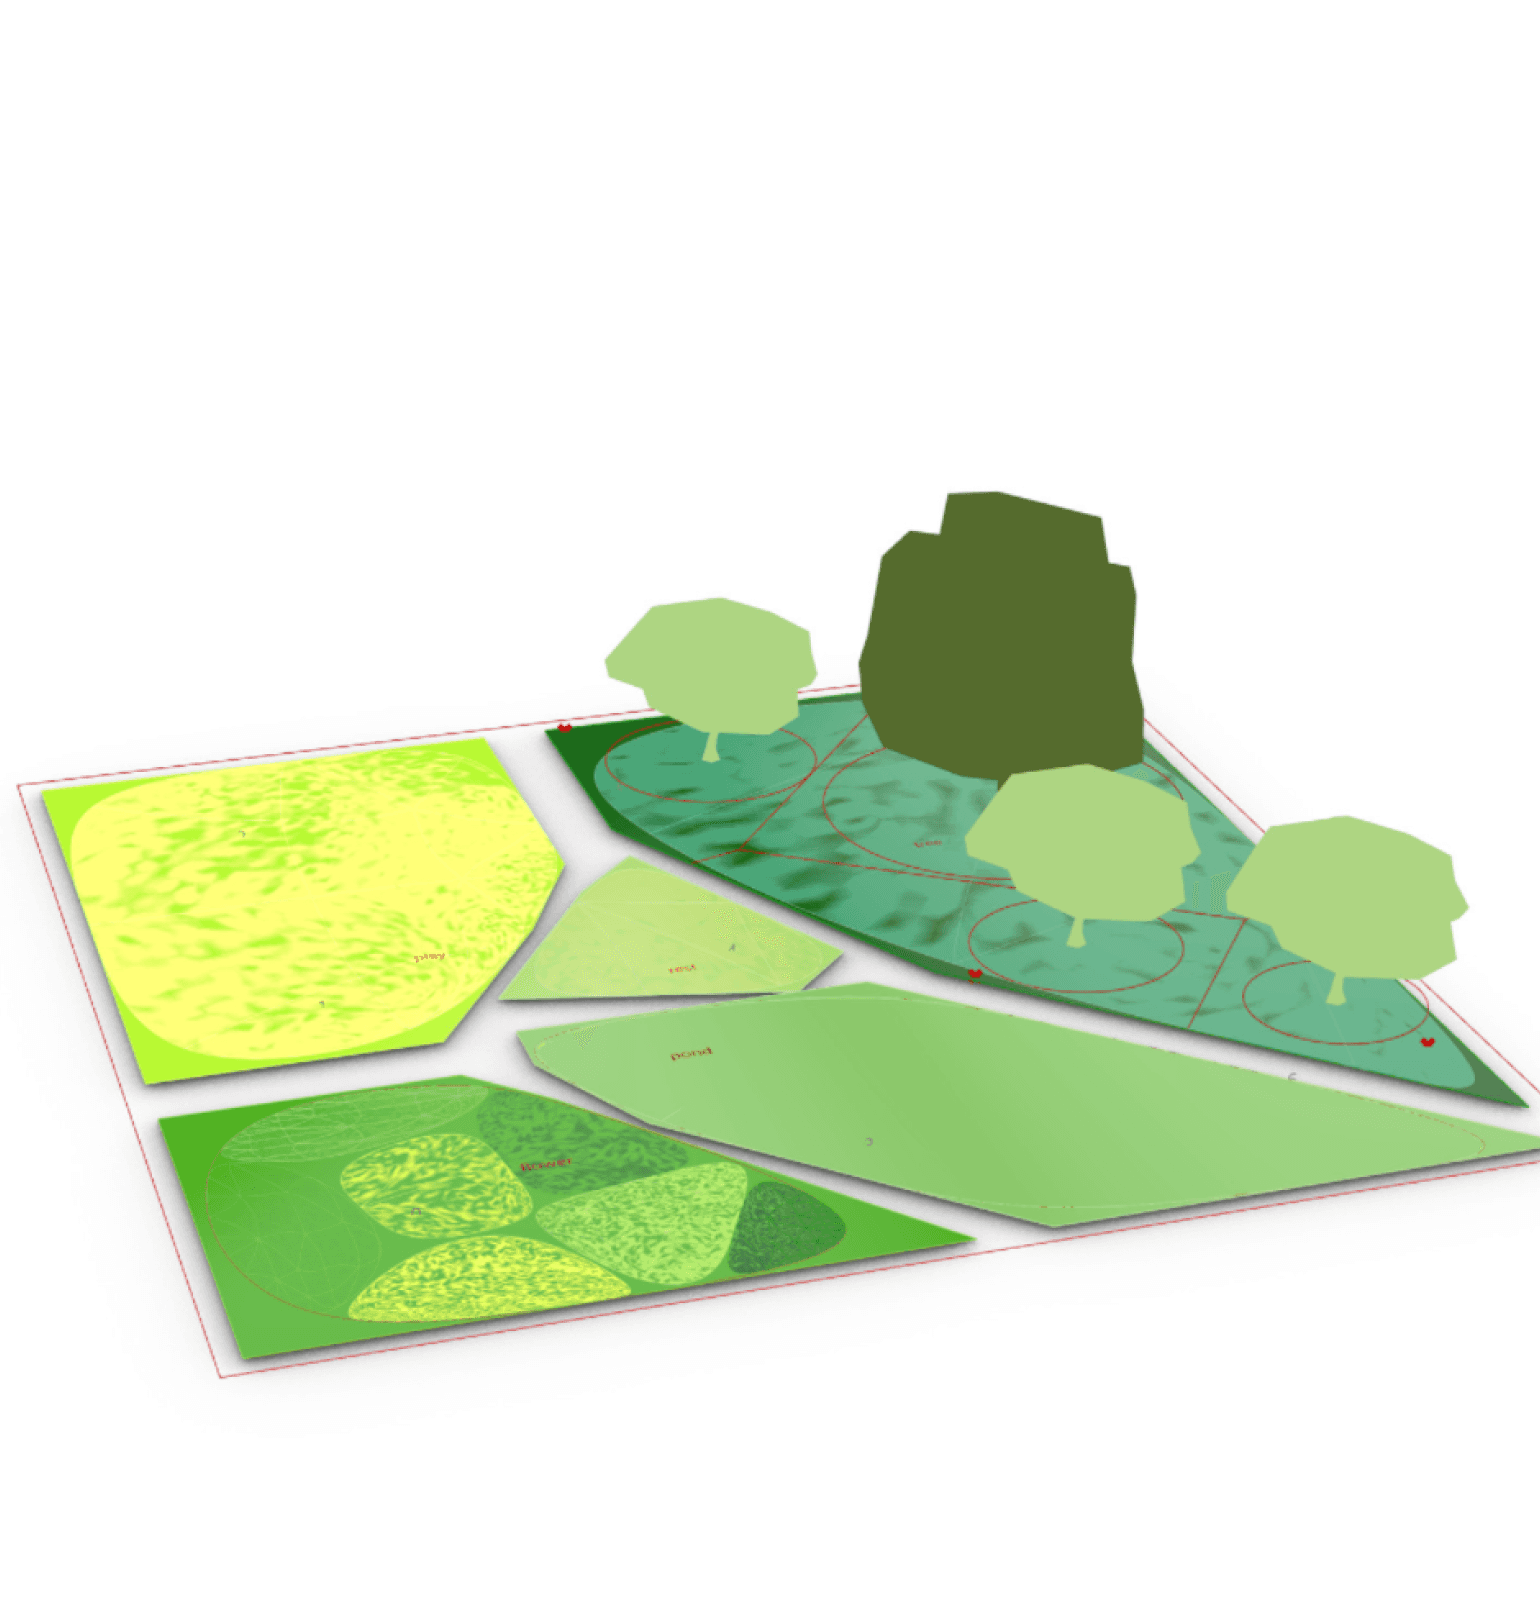
Anchor-driven clustering then relaxes the graph across a surface, generating legible spatial distributions rather than arbitrary layouts.
Climate Intelligence
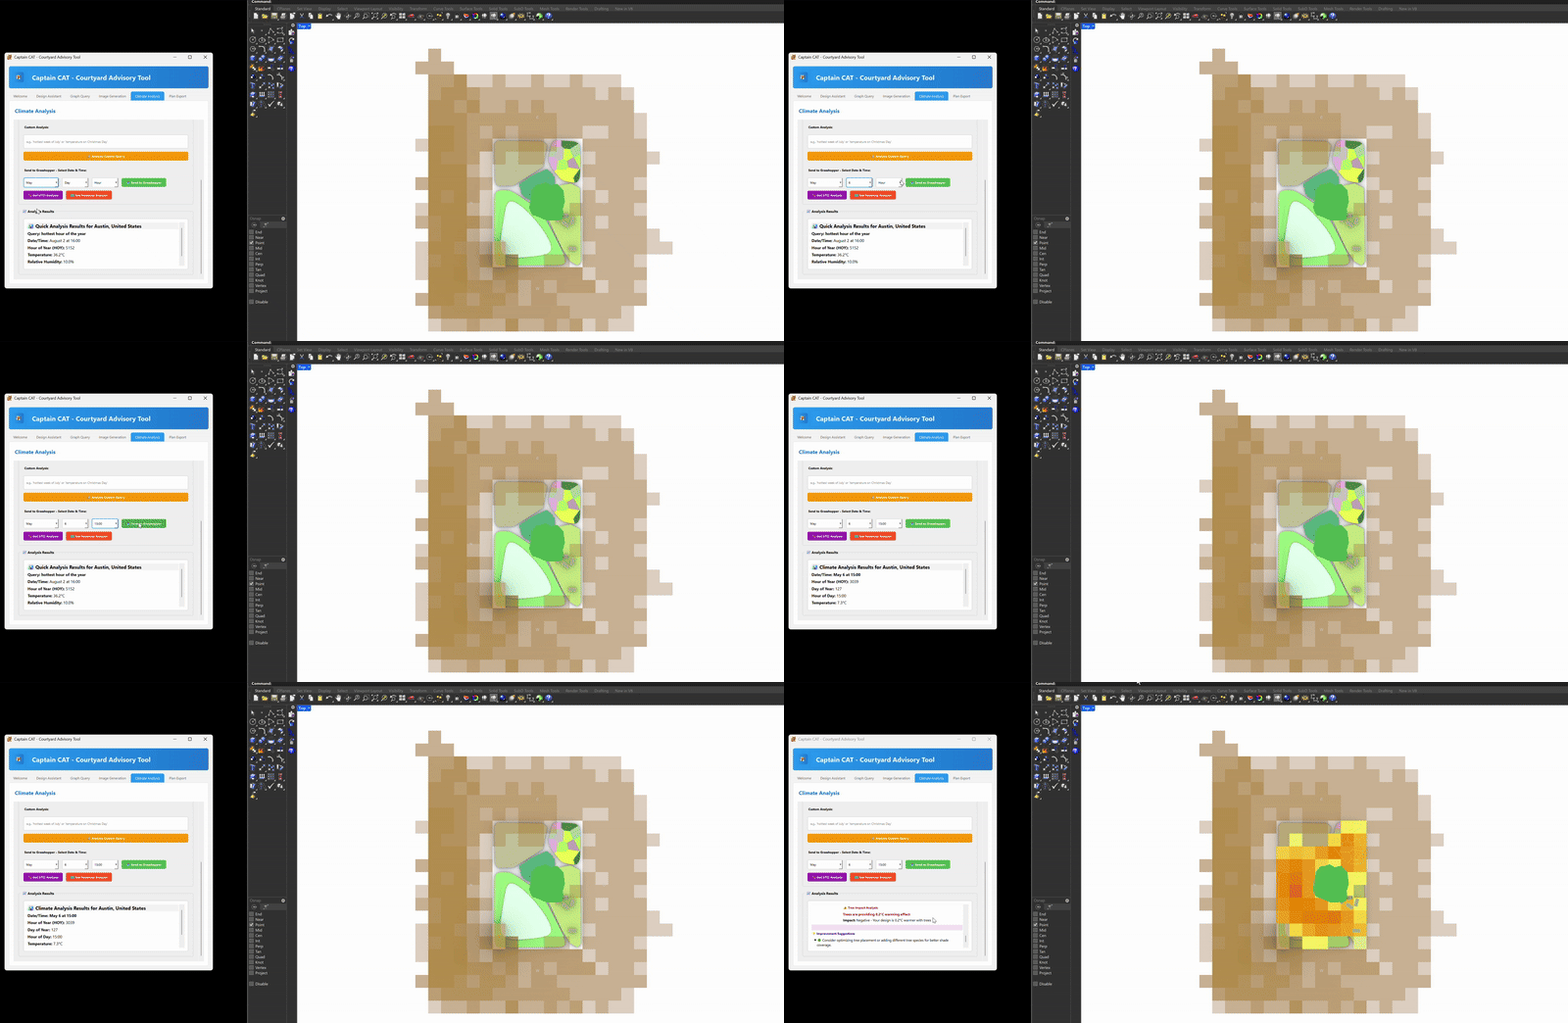
Environmental data enters early. EPW climate files and UTCI analysis inform where people can linger, not just where space exists. Shade, radiation, and comfort are evaluated live as the layout evolves.
Parametric Translation
The graph resolves into geometry inside Grasshopper and Rhino. Designers see immediate 3D feedback, while CAT critiques:
- Connectivity
- Clustering quality
- Climate performance
Generative Imagination
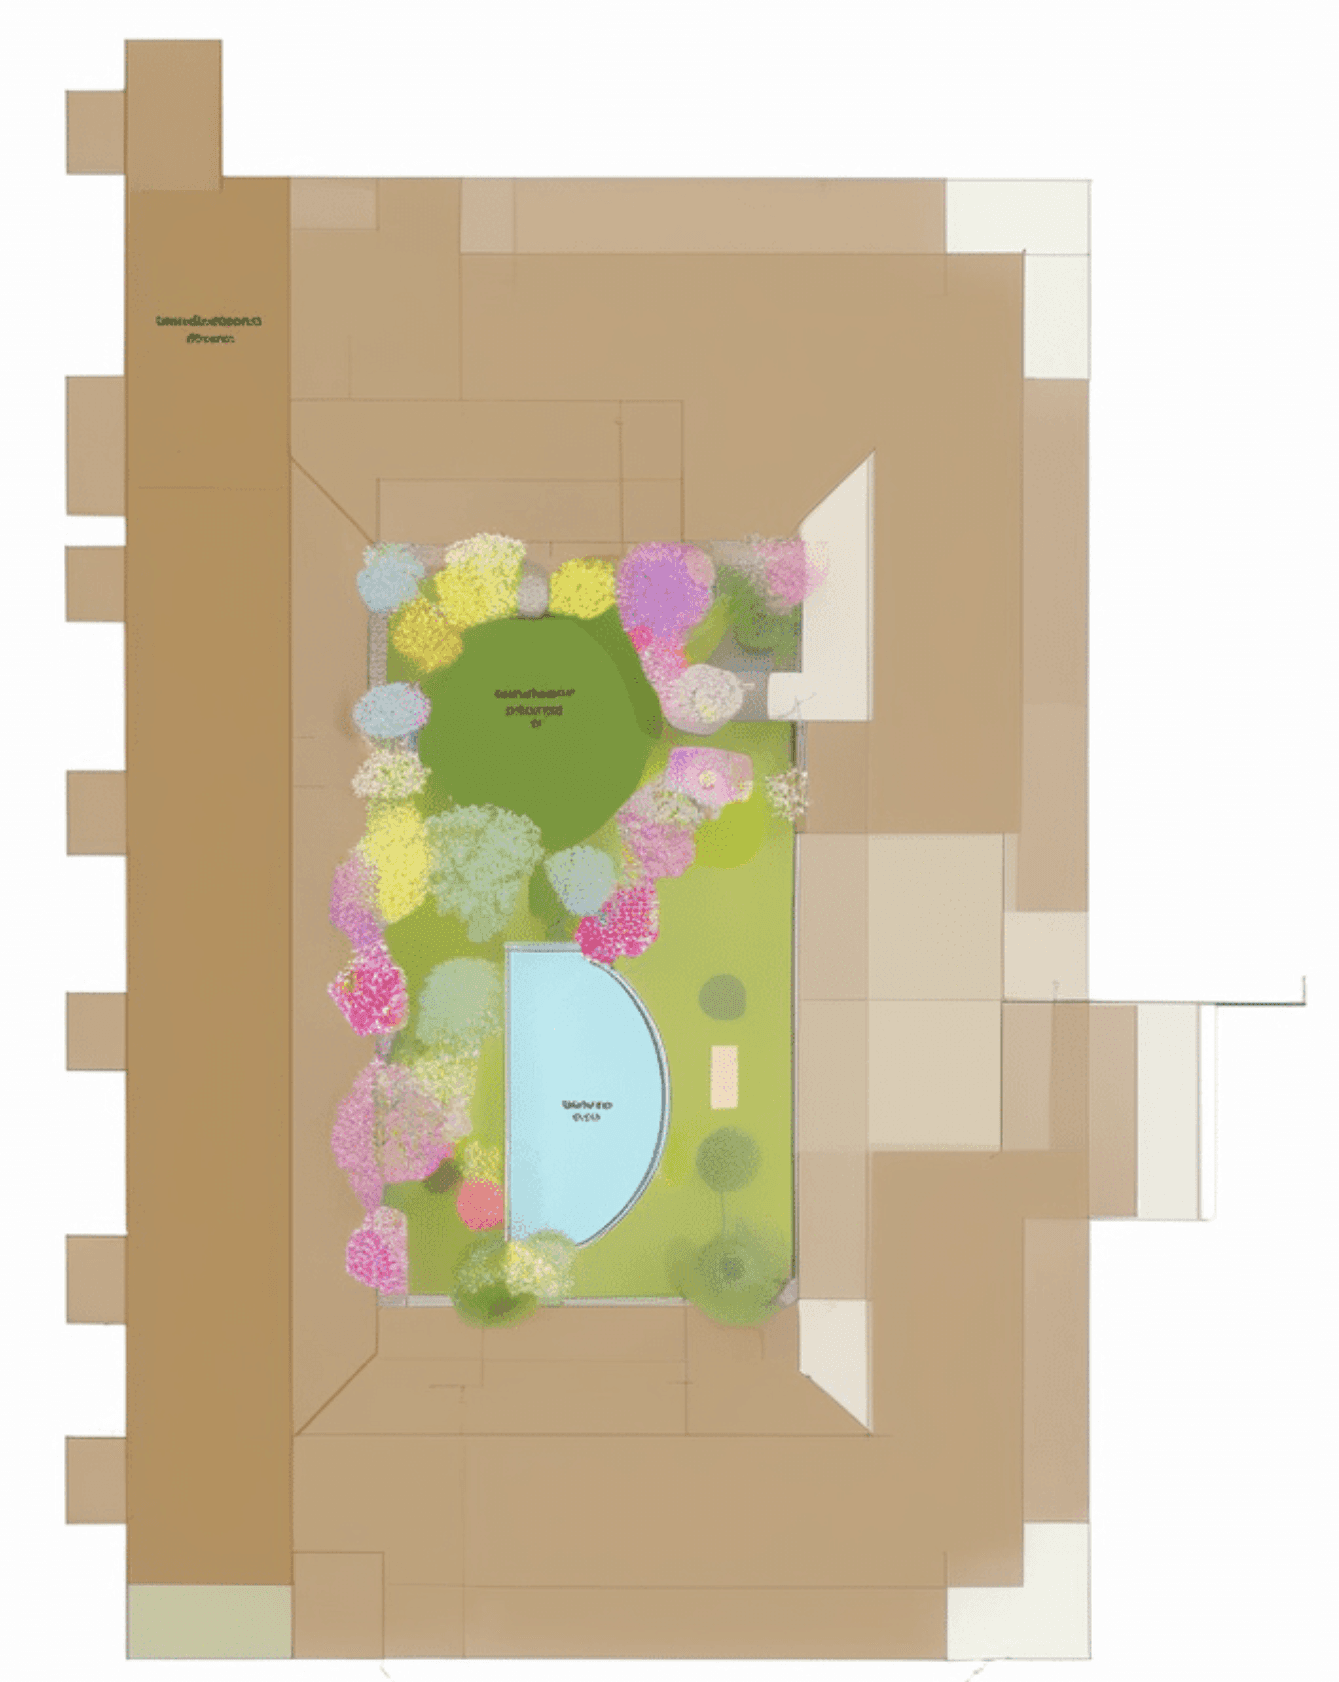
Screenshots are processed through SDXL to generate plans and concept visuals, bridging analysis and storytelling. Each iteration is archived for clients and collaborators as structured PDFs, CSVs, and JSONs.
Graph ML Insights
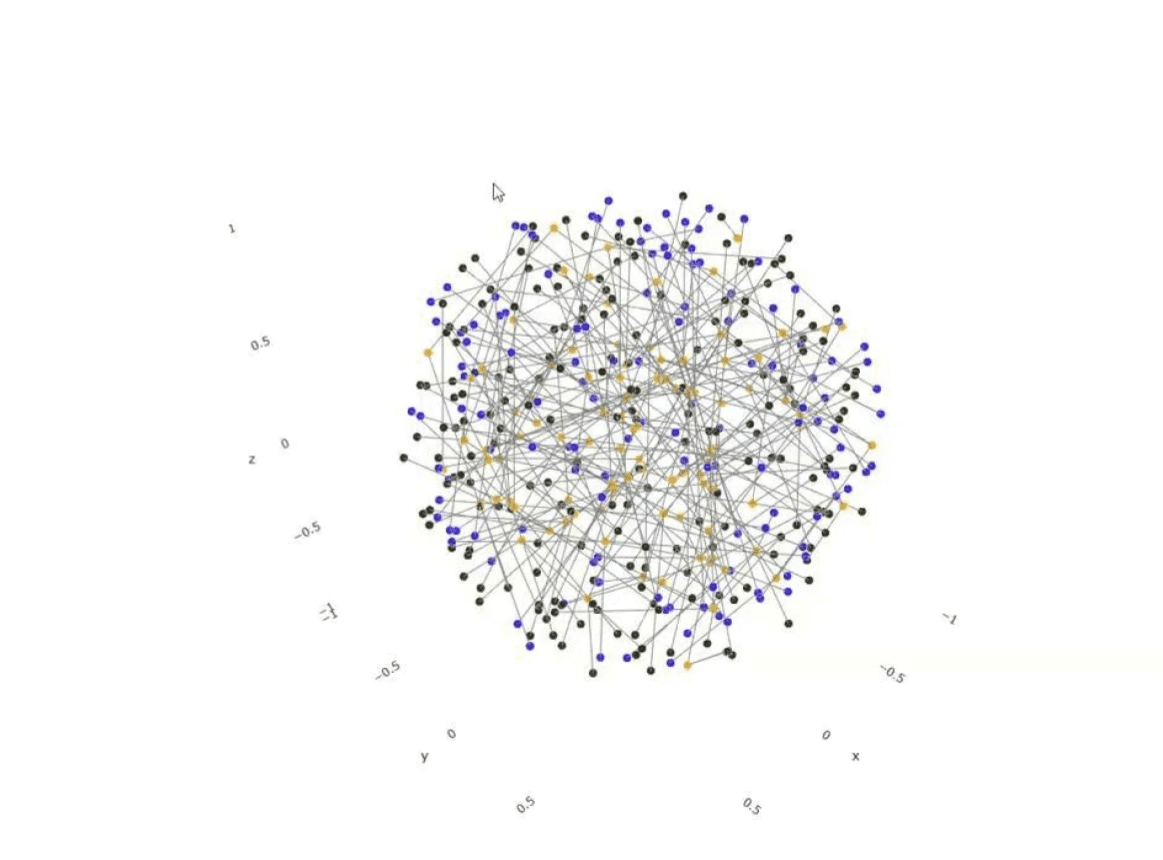
Courtyard and building elements were transformed into a Neo4j graph containing spaces, windows, adjacencies, and environmental metrics. Community detection revealed hidden spatial patterns, informing targeted design improvements.
Real-Time Comfort Prediction
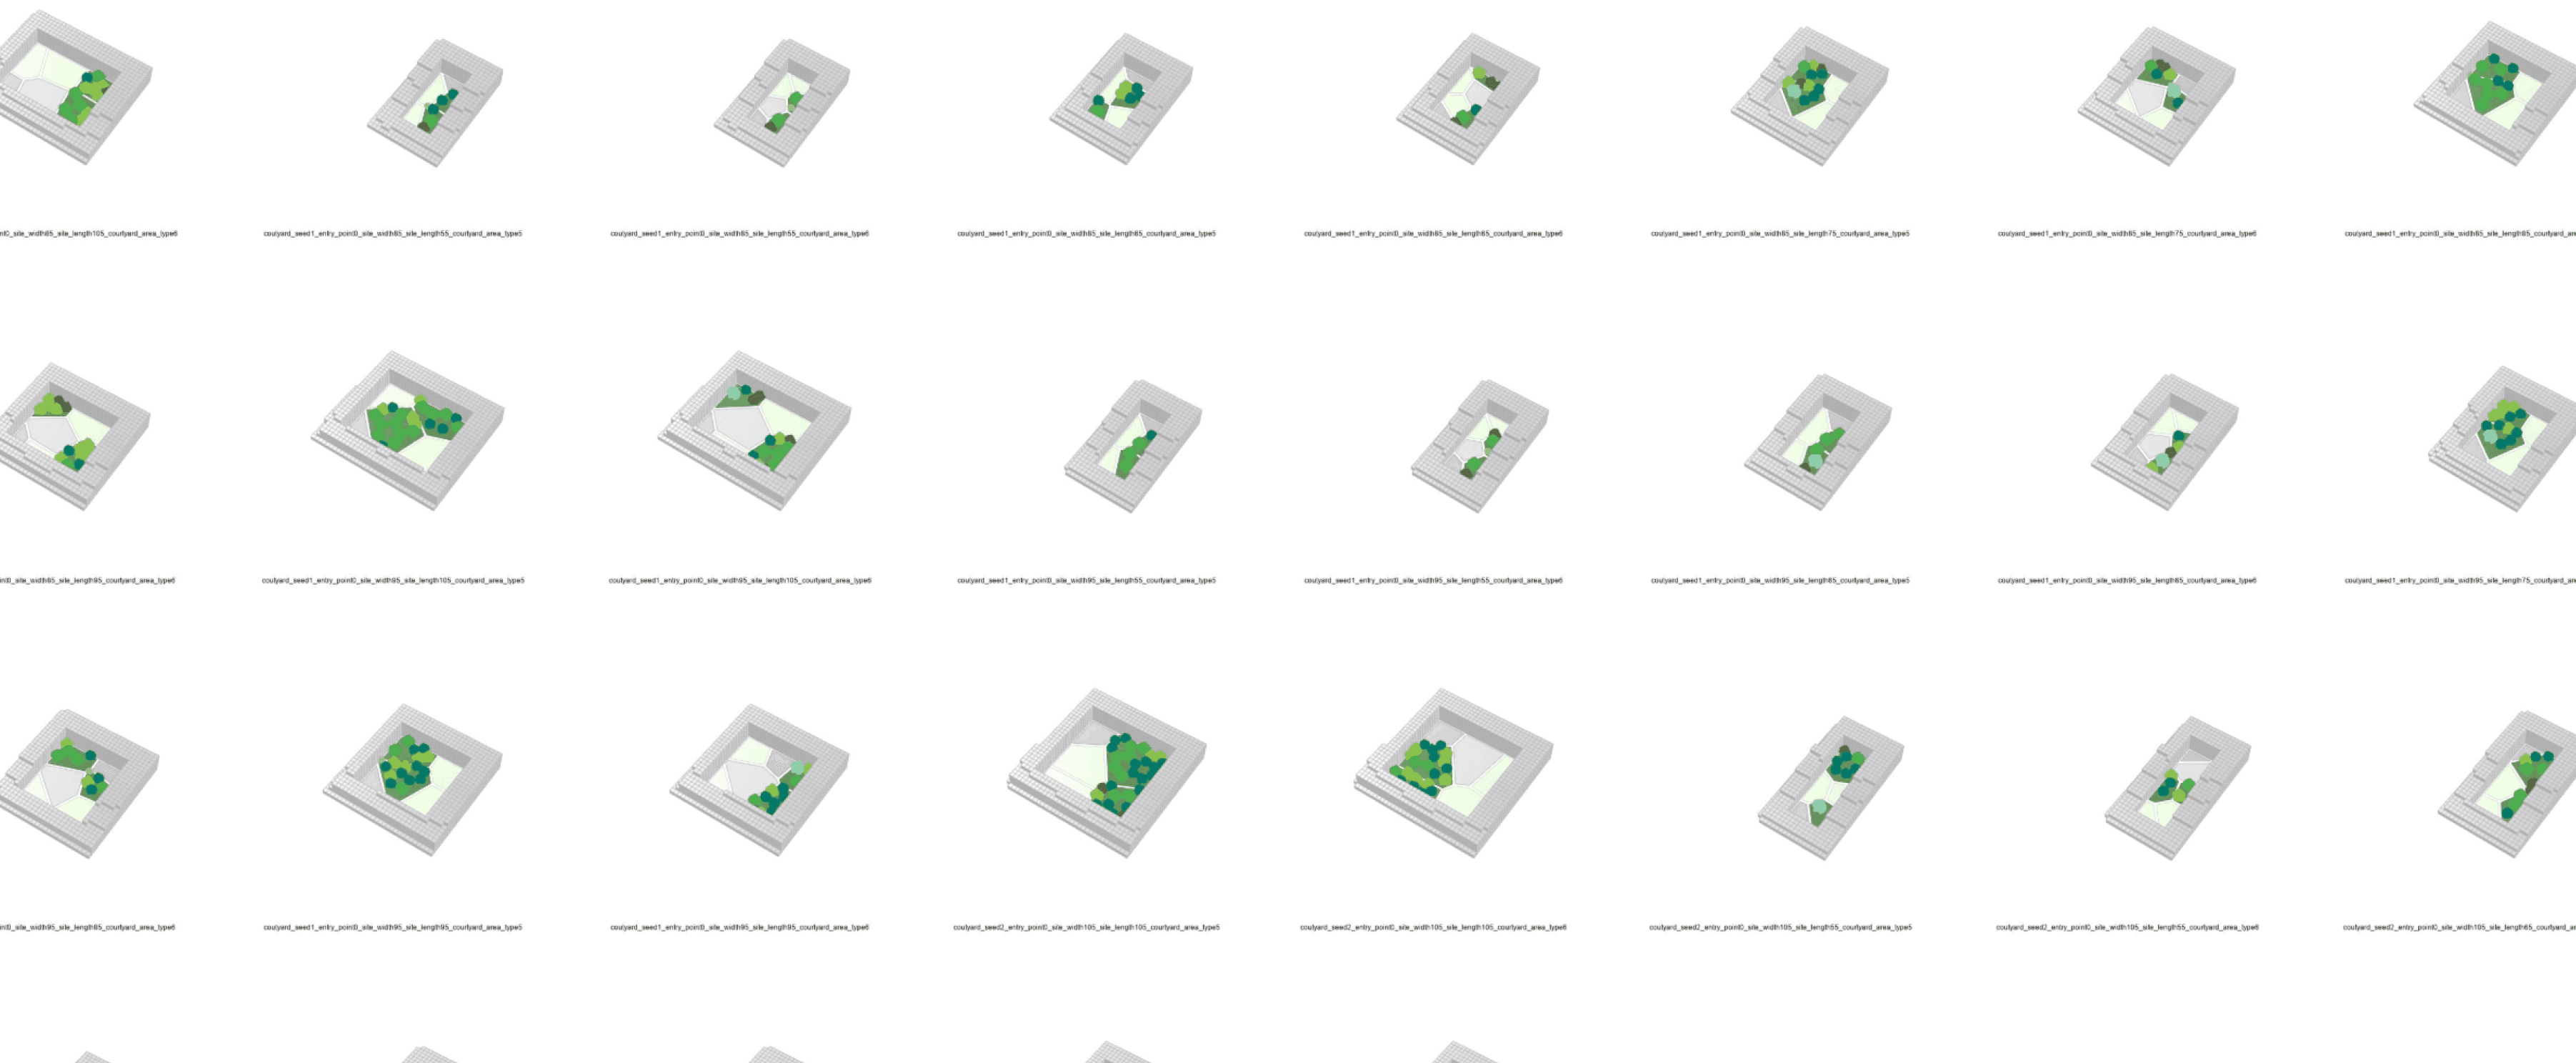
A trained Random Forest model predicts thermal comfort instantly inside Grasshopper, replacing slow simulation cycles with immediate feedback.
- 5,000+ courtyard configurations generated and simulated using UTCI
- Instant thermal comfort prediction, in place of a simulation cycle
Captain CAT is a design intelligence layer that closes the loop between intent, environment, and form. By treating courtyards as living systems rather than leftover space, the project demonstrates how AI can augment architectural judgment without replacing it.
This framework scales beyond courtyards to streets, plazas, and adaptive public spaces, pointing toward climate-responsive digital twins that learn alongside designers.
Project developed in collaboration with Andrea Ardizzi, Leila Sheikh, and Lennart Hamm for IAAC. You can read the original article on the IAAC blog.